The Estimator
This is an estimator designed to predict apartment prices on the Polish real estate market. It is outputting 2 prices. One comes from the XGB model and the other from the artificial neural network. Below you can find information about its creation and evaluation.
Web scraping
Data required for training the models are being acquired via web scraping from a Polish auction portal. Automatic data acquisition is not prohibited by portals' terms of use. The procedure does not interfere with its functioning. The result is a set of observations with 14 parameters:
- city - city in which the apartment is located
- district - city district
- voivodeship - Polish administration region
- localization_y - geographic location: latitude
- localization_x - geographic location: longitude
- market - primary market, aftermarket
- offer_type - sell (safety check)
- area - total area of the apartment
- rooms - total number of rooms in the apartment
- floor - floor on which the apartment is located
- floors - total number of floors in the building
- build_yr - year in which the apartment was built
- price - price of the apartment in PLN
- url - address of the website with the advertisement
Data preparation
About 50% of observations are not suitable for training. They are missing significant information that is highly impacting the final price.
~18% of data has no price to begin with. The remaining ~30% have no built year and ~5% are missing the information about the floors.
The rest of the data is fairly complete, only 1-3% values per variable are missing.
The categorical data are being checked for consistency. Only information about the floors needs processing. In border cases,
they are descriptive instead of numerical.
Information about the price per m2 is being added for further preprocessing and analysis.
Data below 1st percentile and above 99th percentile for variables: "area", "price", "price_of_sqm"
are being considered outliers. The same is true for "build_yr" lower than 1900. Some outliers are also present in latitude and longitude.
Points that they are describing are outside the Polish border despite clearly Polish administration information.
In some rare cases, the values of the coordinates are numbers with no decimal places,
which suggests some kind of algorithmic assignment not in line with the actual location.
Data don't need to be corrected for skew and kurtosis.
K-means clustering
The best practice is to train the model on geolocation data organized into bins. Otherwise, the model will struggle to find patterns
in a two-dimensional continuous plane with many local extremes. The final price is driven by the coordinate values, but not in a proportional
manner.
There are two ways to approach this issue. The first one is to use city/district values. They are naturally organizing
the data into bins. However, it is getting problematic to assign new points to those bins. It requires address analysis and
validation. Also, it is very likely that the model is not training on all possible locations. It will not be able to predict output for
locations that it hasn't seen before.
The second way is to use latitude and longitude values to create virtual bins. Covering the area by grid with predefined resolution
will make it easy to group the existing data points and also to put any given point into an already existing bin.
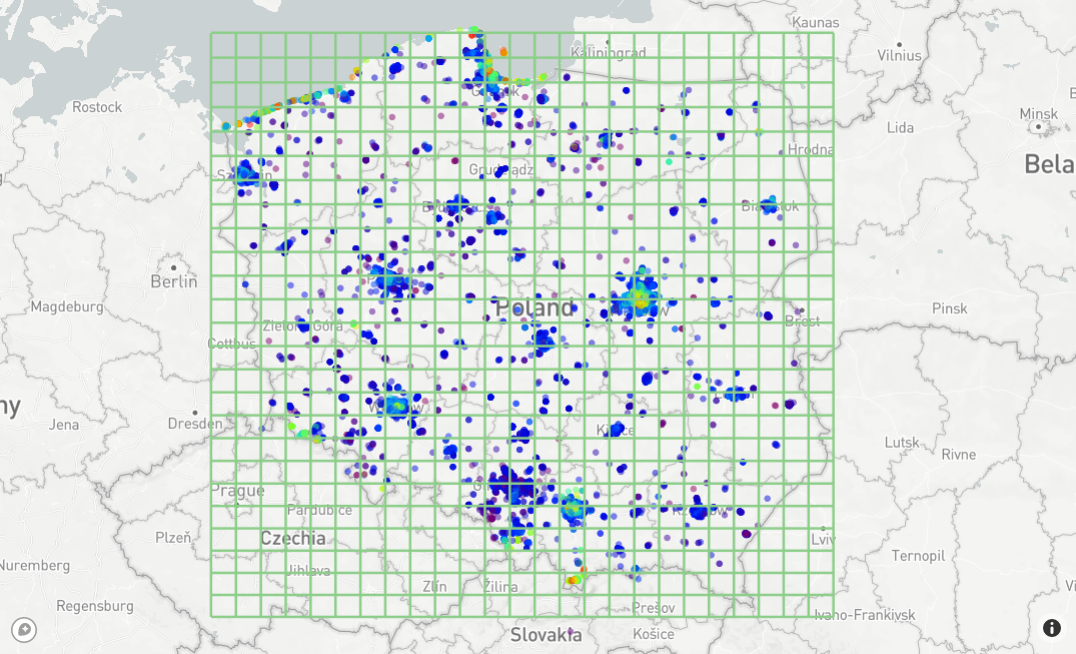
This method is simple but unfortunately not efficient. It is visible after zooming the map.
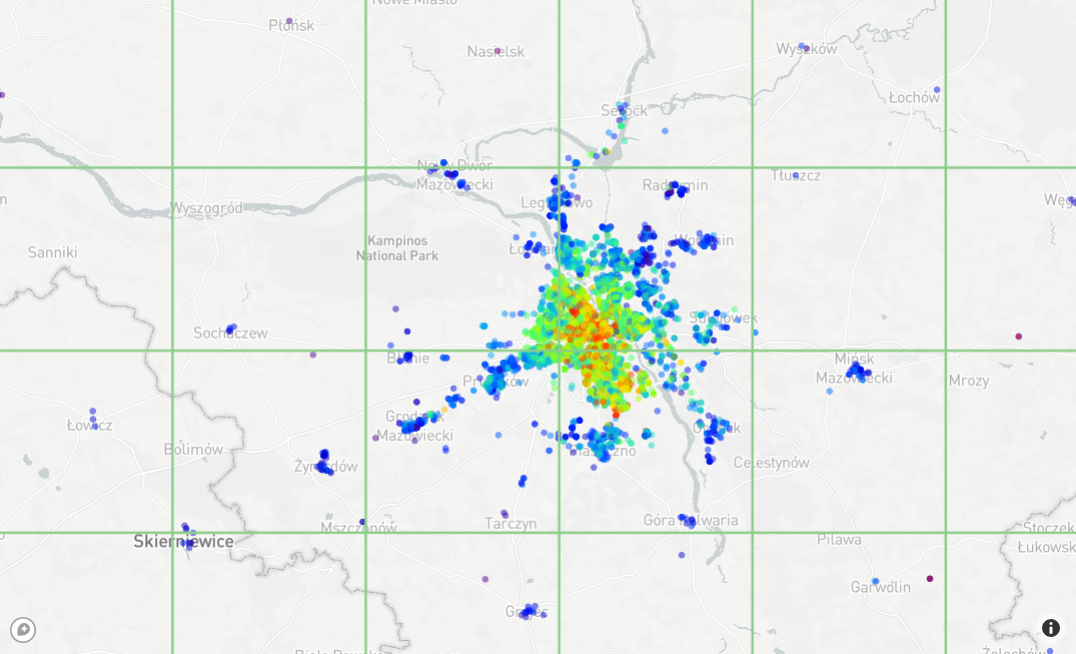
625 bins grid is not enough to reflect the complexity of apartment price structure on the city level. There are also bins that are completely empty, with no points to train the model. To correctly group the data, at least x10 higher resolution is required.
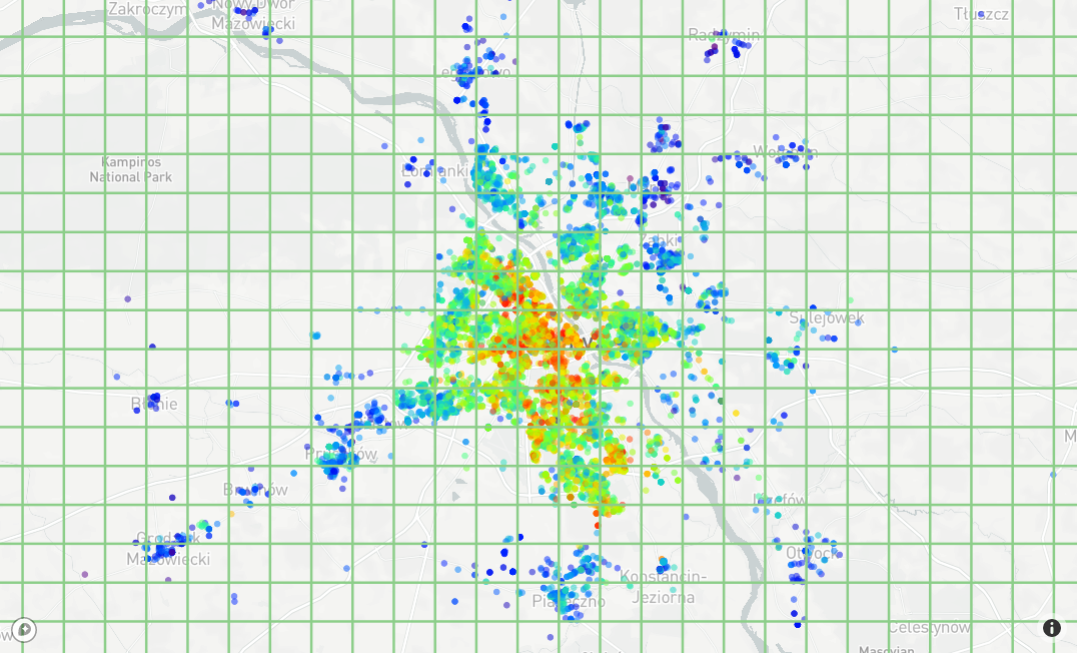
x10 denser grid means that there are now 62.5k bins with only a small amount of them covered by data points. This is clearly not a correct approach.
There is a better way, the k-means clustering algorithm. It is grouping the locations into a predefined number of bins-clusters. The cluster size is correlated to point density. More dense regions have smaller clusters and less dense bigger ones. Clustering performed for this project has been done only on latitude and longitude values, so it is purely geometric. Despite the simplicity, it is doing a great job. Here is the clustering visualization for the whole country.
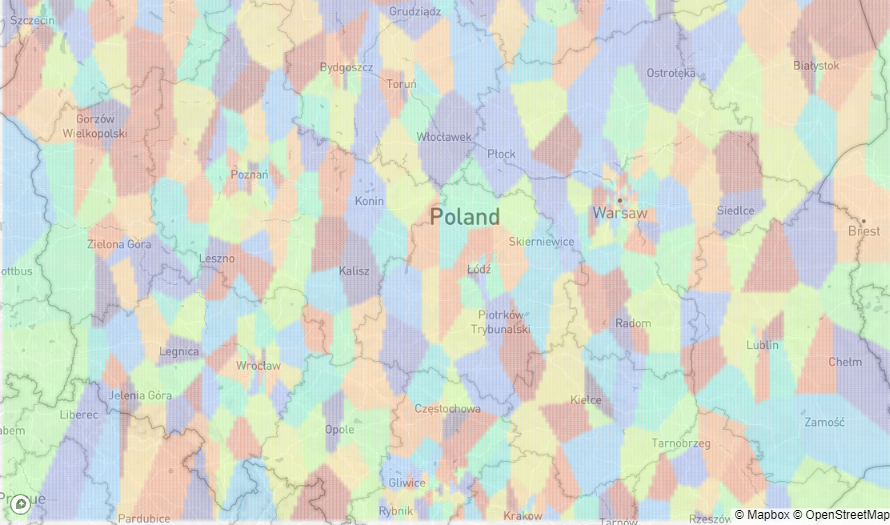
There are no empty clusters. Each one has a different size and shape. In the areas between cities where there aren't many apartments on sale, the clusters are big. They are getting smaller the closer to cities they are, and even finer in the city centers. This behavior is beneficial to price estimators because apartment prices change quickly at small distances in the cities and are stable in bigger areas between them. The city clusters more or less reflect the district structure, or at least they are in the same size order of magnitude.
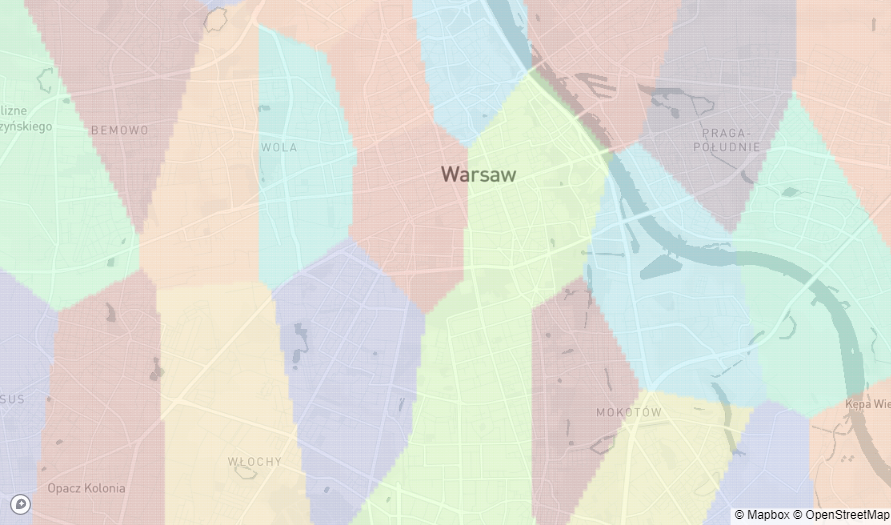
The cluster amount selection is purely arbitrary and was determined by experiment. Different values have been tested and 600 seems to be a good balance between accuracy and efficiency. Below you can see how the prices per m2 (represented by dot size) are correlating with the clusters (represented by dot color).
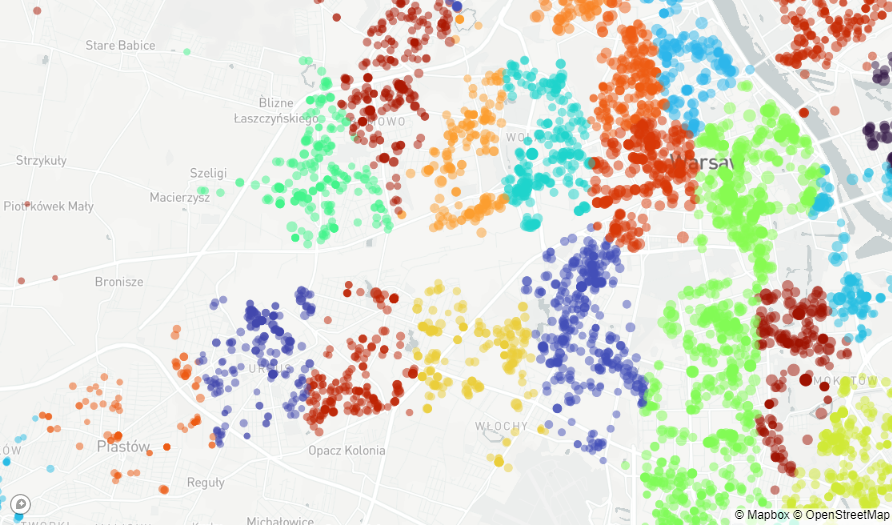
Cluster parameter is added to the data set and redundant location information (address and geolocation) is removed.
ML pipeline
The whole ML pipeline (data acquisition, data preparation and models training) is being run automatically in an Apache Airflow instance on a schedule.
The last run has been finalized on Jan 17 2026.
As mentioned, the app is using two models. They are quite simple, but perform very well:
- ANN - artificial neural network with three hidden layers, R2 in the latest run is 0.84
- XGB - Extreme Gradient Boosting algorithm with 500 estimators, R2 in the latest run is 0.87